| Key Links |
| - Accessibility - Pricing - Free Trial - Order Form - Downloads - My Account - Contact Us - FAQ |
| Data Packages |
| - Stocks - Futures - Forex - Data Content Tables - FAQ |
| Norgate Data Updater |
| - Overview - Installation - Usage - Watchlist Library - Tools - FAQ |
| AmiBroker Plugin |
| - Overview - Plugin Installation - Database Creation > Database Layout and Content - Usage - Known Issues - FAQ |
| Python Package |
| - Installation & Usage |
| Zipline Package |
| - Installation & Usage |
| RightEdge Plugin |
| - Overview - Plugin Installation - Plugin Configuration - Usage - FAQ |
| Wealth-Lab Extension |
| - Overview - Extension Installation - Extension Configuration - Usage - FAQ |
| Notes |
| - Refunds Policy - Privacy Policy - Licence Agreement - NDU Change Log - System Requirements - Alternative Market Glossary |
AmiBroker Database Layout and Content
Data FieldsAmiBroker Symbols Window
Sectors
AmiBroker Information Window
AmiBroker Charts Window
Data Fields
AmiBroker has fields for Ticker, Date, Open , High, Low, Close, Volume, Open Interest, Aux1 and Aux2.
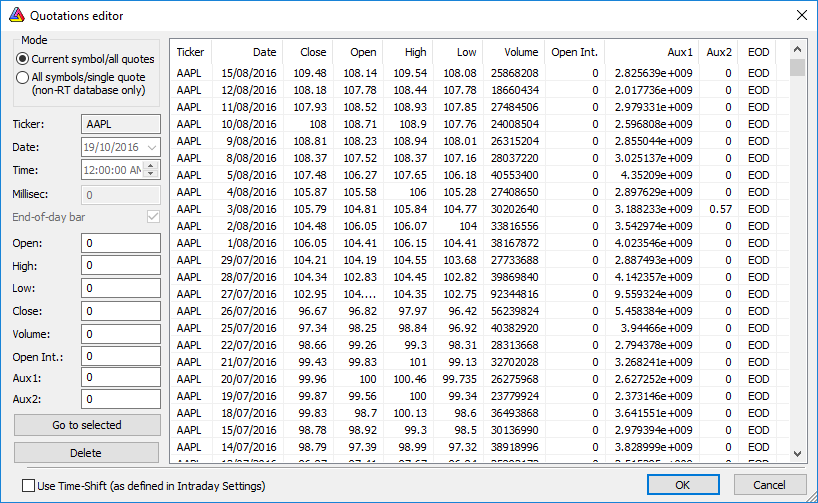
Notes:
- Open Interest - this field is only applicable for futures and derivatives data.
- AUX1 (for Stocks) - shows Turnover, which is the dollar amount of the stock traded on the day.
- AUX1 (for Continuous Futures) - identifies the current contract month in the series by year and month.
- AUX2 and Dividends - dividends are shown in the AUX2 field depending on whether or not they have already been accounted for in the data by the "Price Adjustment" method.
- If the data is adjusted for capital reconstructions only, then both special and ordinary dividends are shown.
- If the data is adjusted for capital reconstructions and special dividends, then only ordinary dividends are shown.
- If the data is adjusted for capital reconstructions, special dividends and ordinary dividends, then no information is shown.
Dividend/Distribution information is shown as of the day before the ex-date - i.e. if you are holding the security at the close, you will be entitled to the dividend/distribution
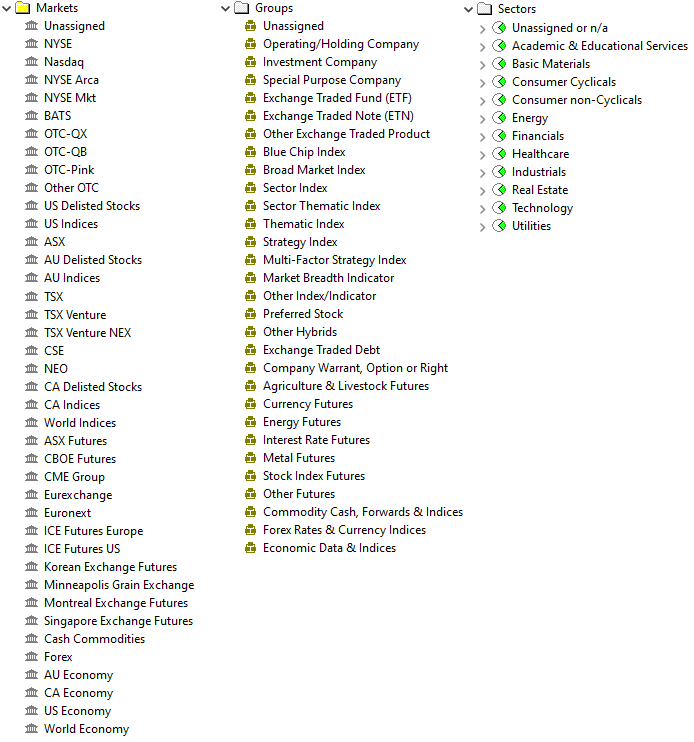
AmiBroker Symbols Window
The illustrations below show the AmiBroker Markets and Groups that may be populated by the Norgate Data plugin:
 Some Group Definitions
 Hide Group Definitions
Sectors
AmiBroker Sectors are populated by the Norgate Data plugin with information from The Refinitiv Business Classification scheme (TRBC).
The Sectors field has two levels - Group and Industry.
Group corresponds to TRBC level 1 (Economic Sector).
Industry corresponds to TRBC level 4 (Industry)
AmiBroker Information Window
The AmiBroker Information Window allows the display of "metadata" and "fundamentals". The Norgate Data plugin populates many of the available fields but not all of them. Fundamental data is provided for most stocks but not all. Also, some stocks do not have broker estimates for forward EPS, target price etc., so these fields may be empty. The tables below identify the fields that are generally populated along with definitions.
All of these fields are accessible in the AFL via the GetFnData function.
"Fundamental" related fields are only included with stock market subscriptions at the Gold, Platinum or Diamond levels.
| Statistics | |||
|---|---|---|---|
| Name | GetFnData Field | Definition | Calculation |
| Shares Out. | SharesOut | Number of shares outstanding | |
| Shares Float | SharesFloat | Number of shares outstanding that are freely available for trading ("Free Float") | |
| % Held by Insiders | InsiderHoldPercent | Data not available for this field | |
| % Held by Institutions | InstitutionHoldPercent | Data not available for this field | |
| Shares Short | SharesShort | Data not available for this field | |
| Shares Short Prior Month | SharesShortPrevMonth | Data not available for this field | |
| Beta | Beta | A measure of a stock's price volatility relative to the market. | The slope of the 60 month regression line of the percentage price change of the stock relative to the percentage price change of the benchmark index. Beta values are not calculated if less than 40 months of pricing is available. |
| Financials | |||
|---|---|---|---|
| Name | GetFnData Field | Definition | Calculation |
| EPS | EPS | EPS excluding extraordinary items - trailing 12 month | The Adjusted Income Available to Common Stockholders for the trailing twelve months divided by the trailing twelve month Diluted Weighted Average Shares Outstanding. |
| EPS Est. Current Year | EPSEstCurrentYear | Current Consensus for EPS | As reported to Refinitiv |
| EPS Est. Next Year | EPSEstNextYear | Data not available for this field | |
| EPS Est. Next Quarter | EPSEstNextQuarter | Data not available for this field | |
| Forward EPS | ForwardEPS | Data not available for this field | |
| Book Value (p.s) | BookValuePerShare | Book value per share - most recent quarter | The Shareholder's Equity divided by the Shares Outstanding at the end of the most recent interim period. |
| PEG Ratio | PEGRatio | Data not available for this field | |
| Profit Margin | ProfitMargin | Net Profit Margin % - trailing 12 month | The Income After Taxes for the trailing twelve months divided by Total Revenue for the same period and expressed as a percentage. NOTE: Most Banks and Finance companies do not report revenues when they announce their preliminary quarterly financial results in the press. When this happens, the trailing twelve month value will not be available. |
| Operating Margin | OperatingMargin | Operating margin - trailing 12 month | The trailing 12 months Operating Income divided by the trailing 12 months Total Revenue, multiplied by 100. Operating Income is defined as Total Revenue minus Total Operating Expenses. |
| 1yr target price | OneYearTargetPrice | Current Consensus Target Price | As reported to Refinitiv |
| Return on Assets (ttm) | ReturnOnAssets | Return on average assets - trailing 12 month | The Income After Taxes for the trailing twelve months divided by the Average Total Assets, expressed as a percentage. Average Total Assets is calculated by adding the Total Assets for the 5 most recent quarters and dividing by 5. |
| Return on Equity (ttm) | ReturnOnEquity | Return on average equity - trailing 12 month | The Income Available to Common Stockholders for the trailing twelve months divided by the Average Common Equity expressed as a percentage. Average Common Equity is calculated by adding the Common Equity for the 5 most recent quarters and dividing by 5. |
| Qtrly Rev. Growth | QtrlyRevenueGrowth | Revenue Change % - most recent quarter 1 year ago | The most recent interim period Sales minus the Sales for the same interim period 1 year ago divided by the Sales for the same interim period one year ago, multiplied by 100. |
| Gross Profit (p.s) | GrossProfitPerShare | Data not available for this field | |
| Sales Per Share | SalesPerShare | Revenue per share - trailing 12 month | The trailing twelve month Total Revenue divided by the Average Diluted Shares Outstanding for the trailing twelve months. NOTE: Most Banks and Insurance companies do not report revenues when they announce their preliminary quarterly financial results in the press. When this happens, the trailing twelve month values will not be available. |
| EBITDA (p.s) | EBITDAPerShare | EBITD per share - trailing 12 month | The trailing twelve month EBITD divided by the Average Shares Outstanding for the same period. EBITD is EBIT plus Depreciation and Amortization expenses (from the Statement of Cash Flows). NOTE: This item is not available for Banks and Insurance companies. |
| Qtrly Earnings Growth | QtrlyEarningsGrowth | EPS Change % - most recent quarter vs corresponding 1 year ago | The most recent interim period EPS minus the EPS for the same interim period 1 year ago divided by the EPS for the same interim period one year ago, multiplied by 100. NOTE: EPS must be positive for both periods. If either EPS value is negative, the result in not meaningful. |
| Operating Cash Flow | OperatingCashFlow | Data not available for this field | |
| Leveraged Free Cash Flow | LeveredFreeCashFlow | Data not available for this field | |
| Dividends & Splits | |||
|---|---|---|---|
| Name | GetFnData Field | Definition | Calculation |
| Dividend | DividendPerShare | Trailing 12 month sum of all split-adjusted ordinary dividends | The sum of the Cash Dividends per share paid to common stockholders during the last trailing twelve month period. |
| Dividend Pay Date | DividendPayDate | Payment date for the current dividend | |
| Ex-Dividend Date | ExDividendDate | Ex-dividend date for the current dividend | |
| Forward Dividend | ForwardDividendPerShare | Current Consensus for Dividend Per Share | As reported to Refinitiv |
| Last Split Date | LastSplitDate | The ex-date of the last share split or reverse split (consolidation) | |
| Last Split Ratio | LastSplitRatio | The ratio of new shares to old in the last split | |
| Delisting Date | DelistingDate | The last day that the security was available for trading before delisting | |
AmiBroker Charts Window
The AmiBroker Charts window has a section for Norgate Data that includes various indicators that can be displayed on a chart. Right-click on an indicator to select "Overlay" or "Insert".
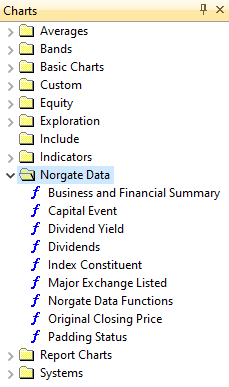
Information about Indicators/Functions available for use in AmiBroker can be seen on our AmiBroker Usage page.